Improving customer experience through UX research for Bistro.sk
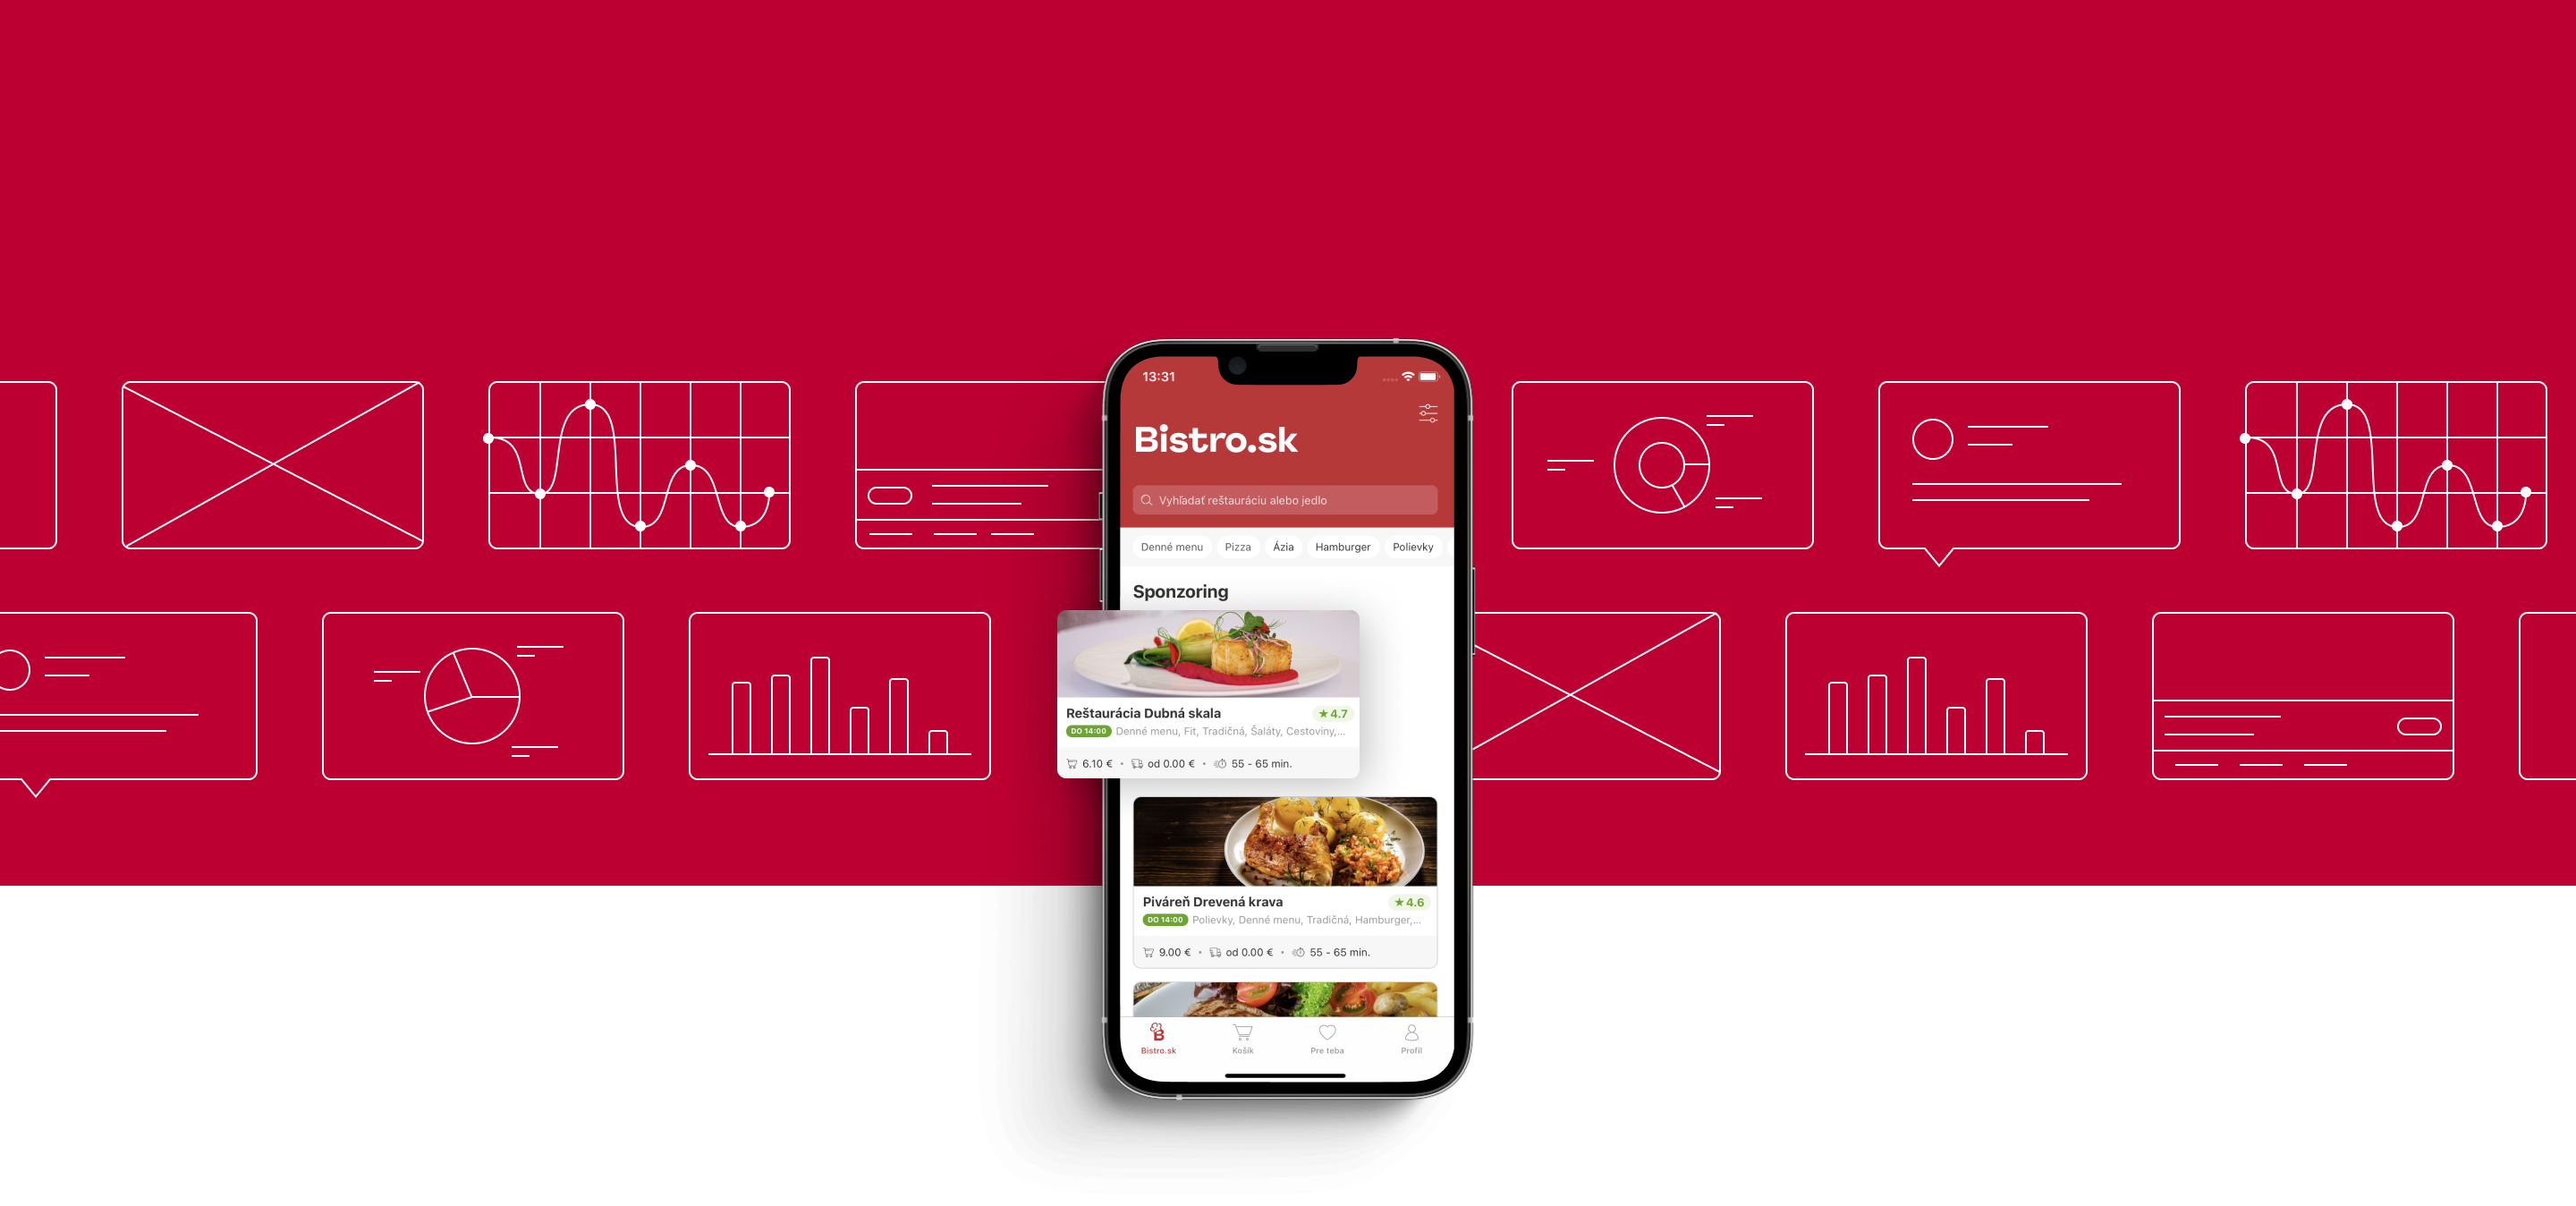
How to strengthen leading position of online food delivery by improving user experience.
In the last two years, the market situation has been significantly affected by the pandemic, which has increased the demand for online food delivery and market potential. The online food delivery market is gradually expanding with more competitors. Using competing products, customers get new experiences that they can evaluate, compare and share. User satisfaction with the product is created by the user experience (UX), which plays a key role in maintaining and growing the number of users. Therefore, it is very important to constantly improve the user experience.
01Challenge
Improving the user experience is an opportunity to dominate in the market
If a product wants to maintain its leading position in a growing market, its user experience must be constantly improved. To make sure we can improve product in the right direction, we must support the recommendations with the relevant information. The goal of UX research is to provide information about users, their needs, issues, preferences and find out how the product is used. The information from real users is necessary to identify problem areas, detect opportunities and formulate recommendations to improve the user experience. For this reason, we carried out UX research focusing on mobile platforms in two phases.
02Process
UX research process
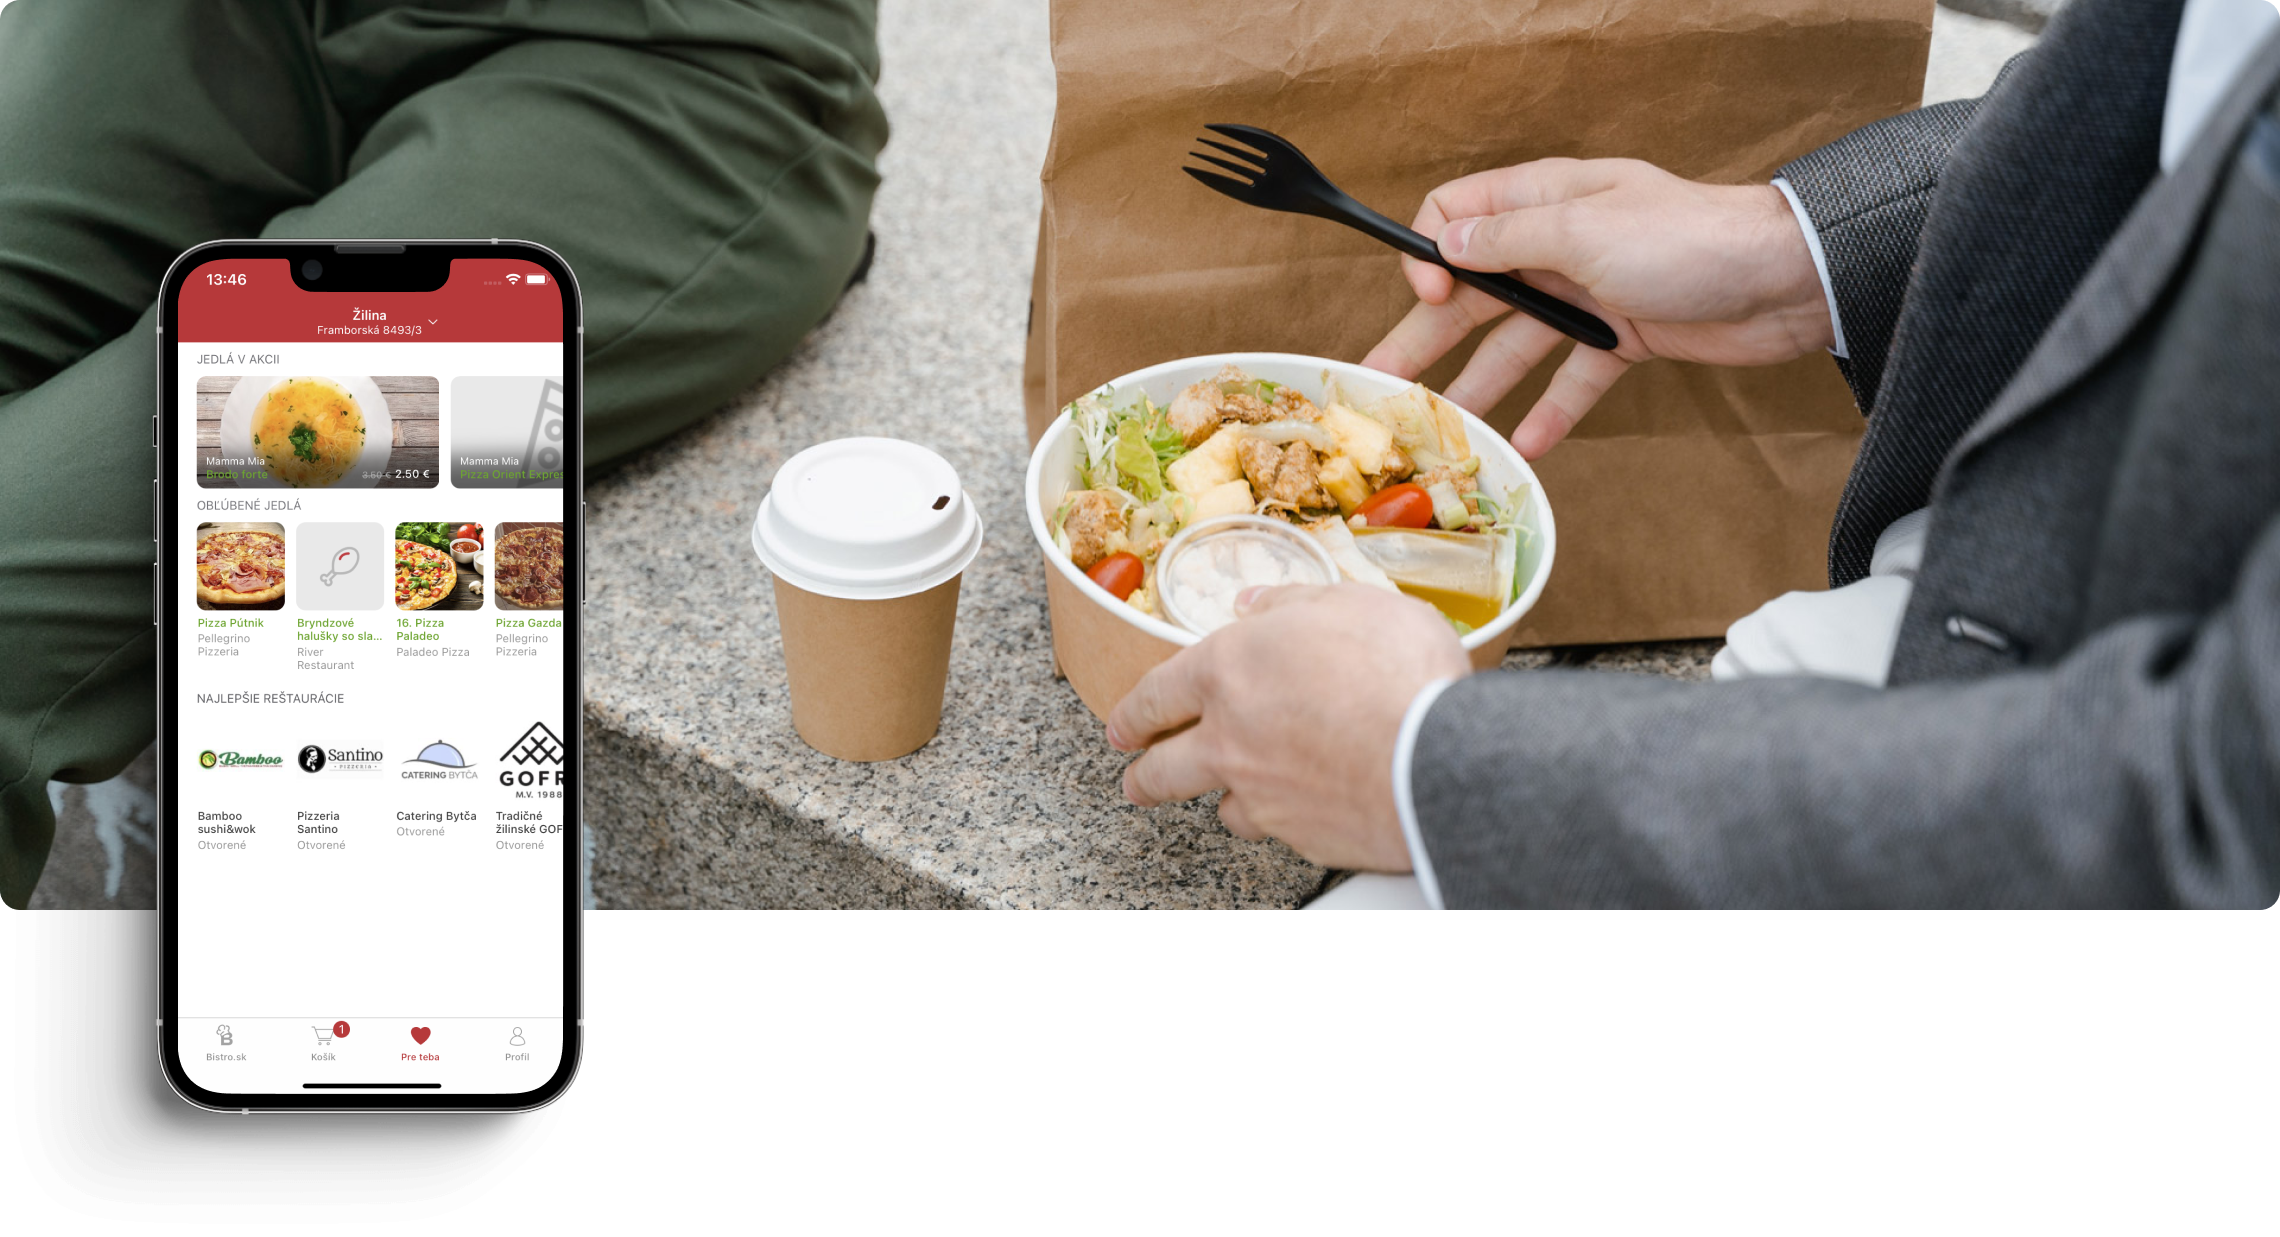
In the first phase, we collected and analyzed quantitative data. We started with a survey in which we asked 155 respondents about preferences, needs and problems when using the product. We continued to examine the application's analytics data, where we were interested in demographic user data and application usage data. By evaluating the quantitative data, we found out the awareness of the products on the market, obtained basic information about user groups and learned about their preferences, needs and problems. We have found that the most important needs of users are the search for food according to their own preferences, a transparent offer, a quick selection of food and the speed of order processing. Therefore, we focused our research on sections that meet these needs. We assigned and summarized the obtained data to the sections. The results pointed to problems to which we added possible causes in the form of hypotheses.
In the second phase, we expanded user information by user research and identified problem areas when using the application. In-depth interviews helped us to find out the needs of users and their experience when ordering food online. By user testing, we learned how the product is used and where problems arise that cause a negative user experience. In the end, we combined all the data and detections, assigned them to sections, and analyzed them to refute or confirm the hypotheses.
What results does UX research provide for the product?

Thanks to the research, we obtained information about the needs, preferences and problems of users, as well as information about problems when using the product. Based on the information we have gained, we have added our recommendations on how to solve user problems, improve the usability of the application and, as a result, improve the user experience.
03Research
Information on current use from quantitative data
We started the research by collecting quantitative data. We conducted a user survey, where we asked about preferences, what is the most important for users, how users choose food and what is their experience with ordering food online. We continued to collect analytical data from 2019 to 2021 in order to demonstrate the current state of use of the application. We were interested in demographics, the year-on-year change in the number of users and traffic in key sections.
A survey of the awareness, preferences and needs of users of online food delivery
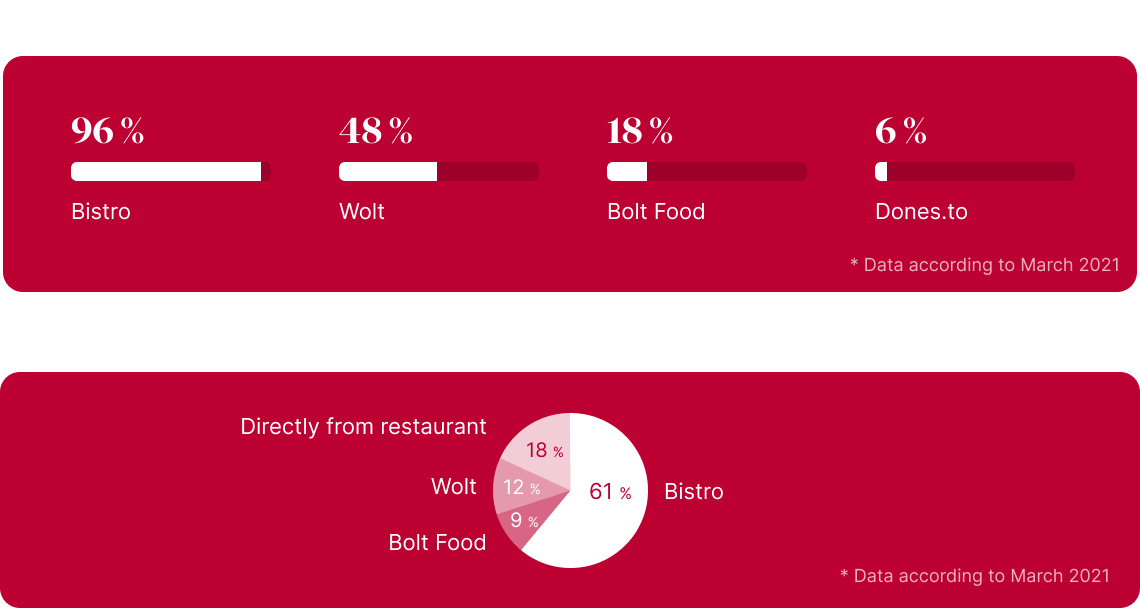
In the survey, we asked respondents about the awareness of products on the market. 96% said they knew Bistro.sk, 48% knew Wolt, 18% Bolt food and 6% dones.to. We asked which service respondents prefer. 61% prefer Bistro.sk, 18% Wolt, 14% Bolt food and 28% order directly from the restaurant.
In order to be able to focus on key sections, we found out in the survey what is important when ordering food online. The most important is the clear menu in the restaurants,the quality description of the food and the speed of ordering food. We were interested in how respondents choose food and how they perceive discounts. An interesting result was that more than 70% choose restaurants and dishes according to their liking. Discounts are crucial for 18% of respondents when choosing the food, but up to 25% do not know about them.

Application usage data
We checked demographic data about users, which helped us select the ideal respondent in the second phase of the research. We have identified 3 main age groups of users. 26% of users are 18 to 24 years old, 36% are 25 to 34 years old and 23% are 35 to 44 years old. 61% of men and 39% of women use the mobile application.

We also examined the data of all and new sessions. A session is a period of 30 minutes during which a user has opened and used an application. In the long run, the number of all sessions is growing. However, the growth decreased from 42% to 38% during the monitored period. At the same time, we found that the number of new sessions has been low for a long time, and in the monitored period, this number decreased from 2.70% to 2%. The use of the Bistro.sk application grew in the monitored period, but the growth has slowed down in the last year.
Based on the results, we concluded that:
- he demand for online food delivery is increasing,
- users know about new competitive products,
- the long-term growth in the use of the Bistro.sk decreased in the monitored period,
- the long-term low number of new users of the Bistro.sk is being decreased in the monitored period.
User research
The aim of the second phase of the research was to obtain information about the user experience. We were interested in the cases in which the respondents used the service, how they ordered food, the most common problems in choosing food and recommendations for improvement. To obtain this information, we applied the method of in-depth interviews with respondents from the main user groups according to the obtained demographic data. In the end, we gathered user needs, preferences, problems, and recommendations that would improve their user experience.
We continued our user research to find out how the product is used and to identify problem areas. We chose a usability testing method for which we selected suitable respondents and prepared a scenario with the tasks they had to complete. During the implementation, we talked to the respondents, perceived natural reactions and note the problem areas that arose when using the product. In case of problems, we asked additional questions in order to better understand the problems.
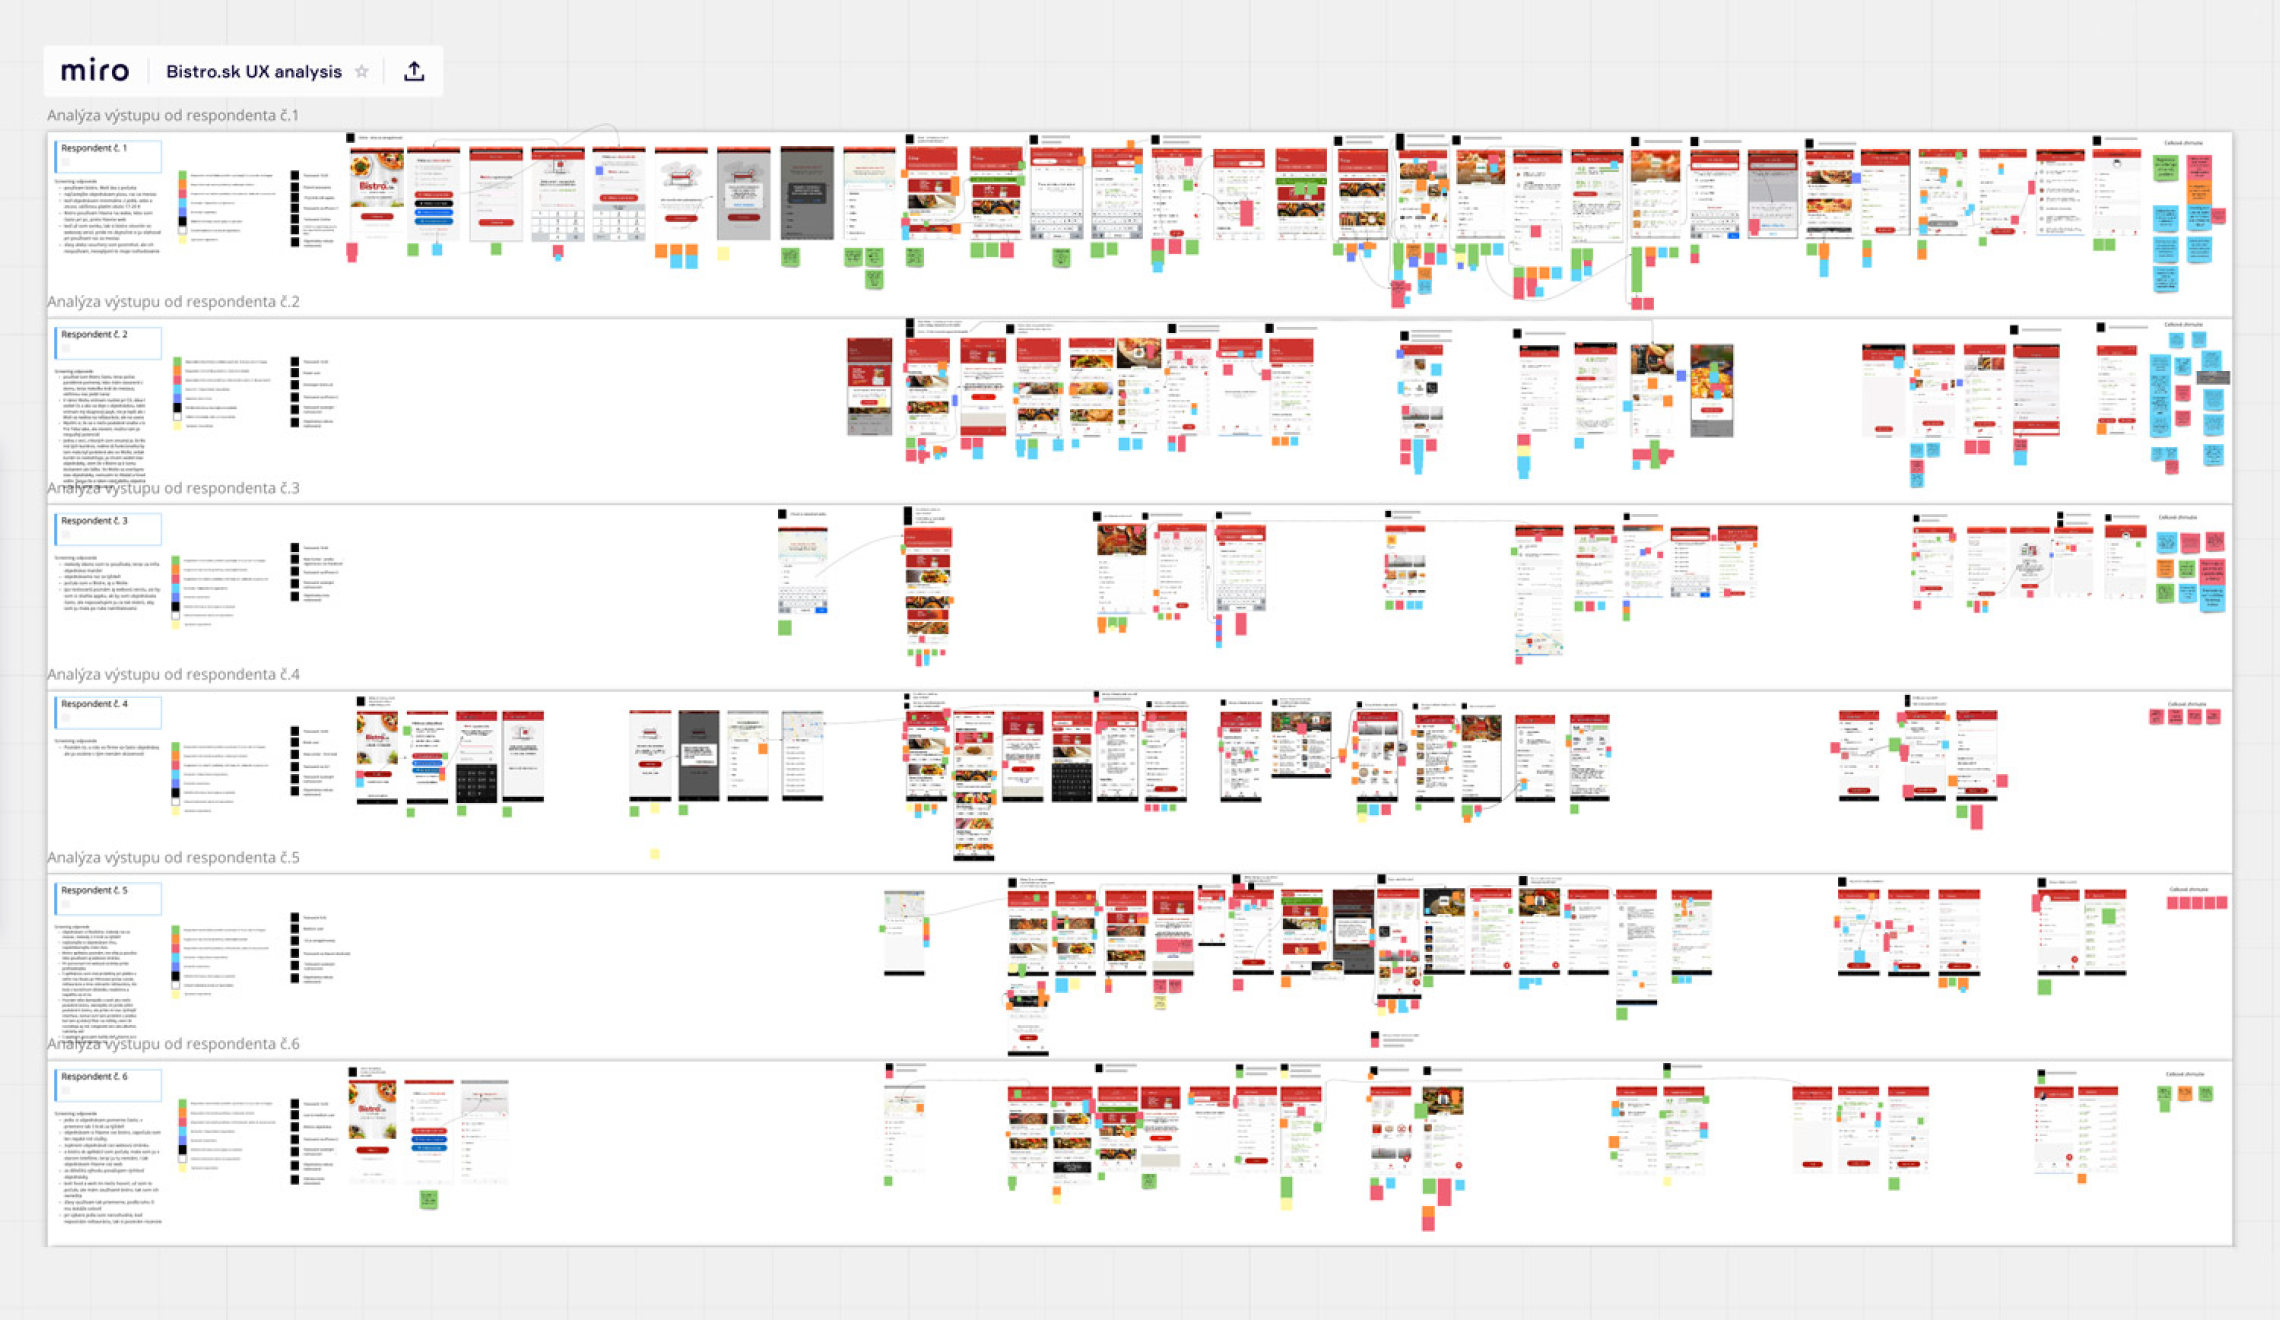
At the end of the user research, we made a thematic analysis of all findings. We assigned colors to the findings by type and sections by origin. The result was a visual aggregation of data on the board, which served for a comprehensive perception of the user experience, analysis of problem areas and verification of established hypotheses.
04Findings
Research results for key sections in mobile application
Based on the most important needs of users, we have thoroughly researched the following sections in the mobile application: restaurant detail, search filter, section "For you" and a cart with complementary sales. Combining relevant data allowed us to identify problems, formulate conclusions, and hypothesize what could lead to a negative user experience. We completed the user research with information about the needs and behavior of users and verified the hypotheses. Based on the research results, we added our recommendations on how to solve user problems, improve the usability of the application and, as a result, improve the user experience.
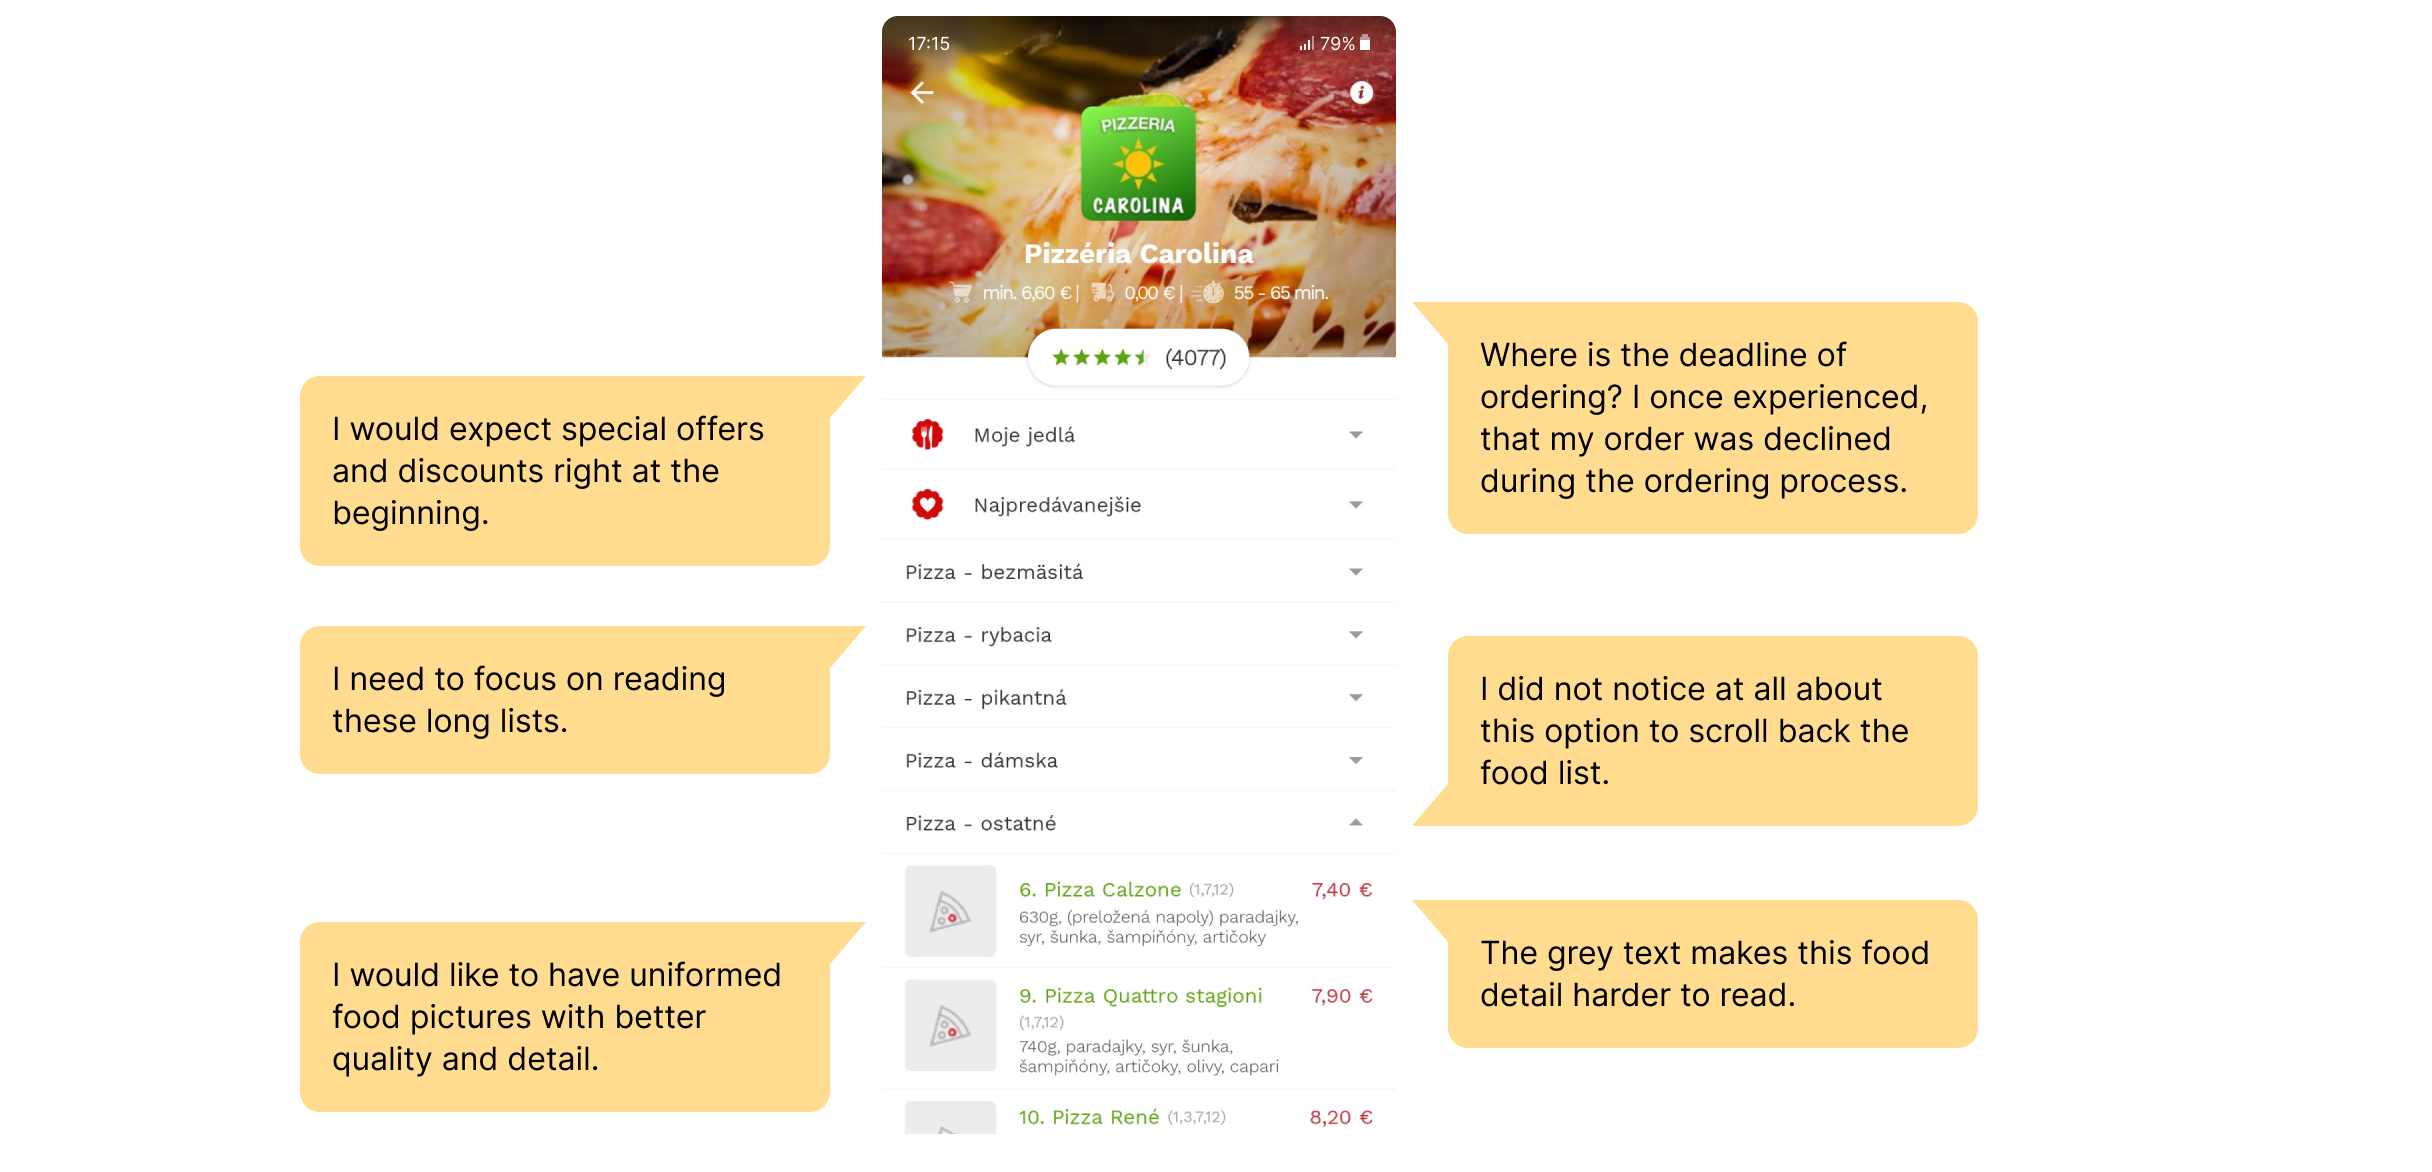
Restaurant detail
Users choose from a menu of restaurants on the home page. Users spend on average 27 seconds choosing food and visit 3 restaurants during 1 session. Up to 62% of users do not choose from the menu during their first visit. 20% of them will close the application on the home page, 10% in the restaurant detail. Users have trouble choosing a preferred restaurant because they repeatedly switch between restaurants and they have trouble finding a preferred food because most of them do not choose from the first visit to the restaurant.

HYPOTHESIS
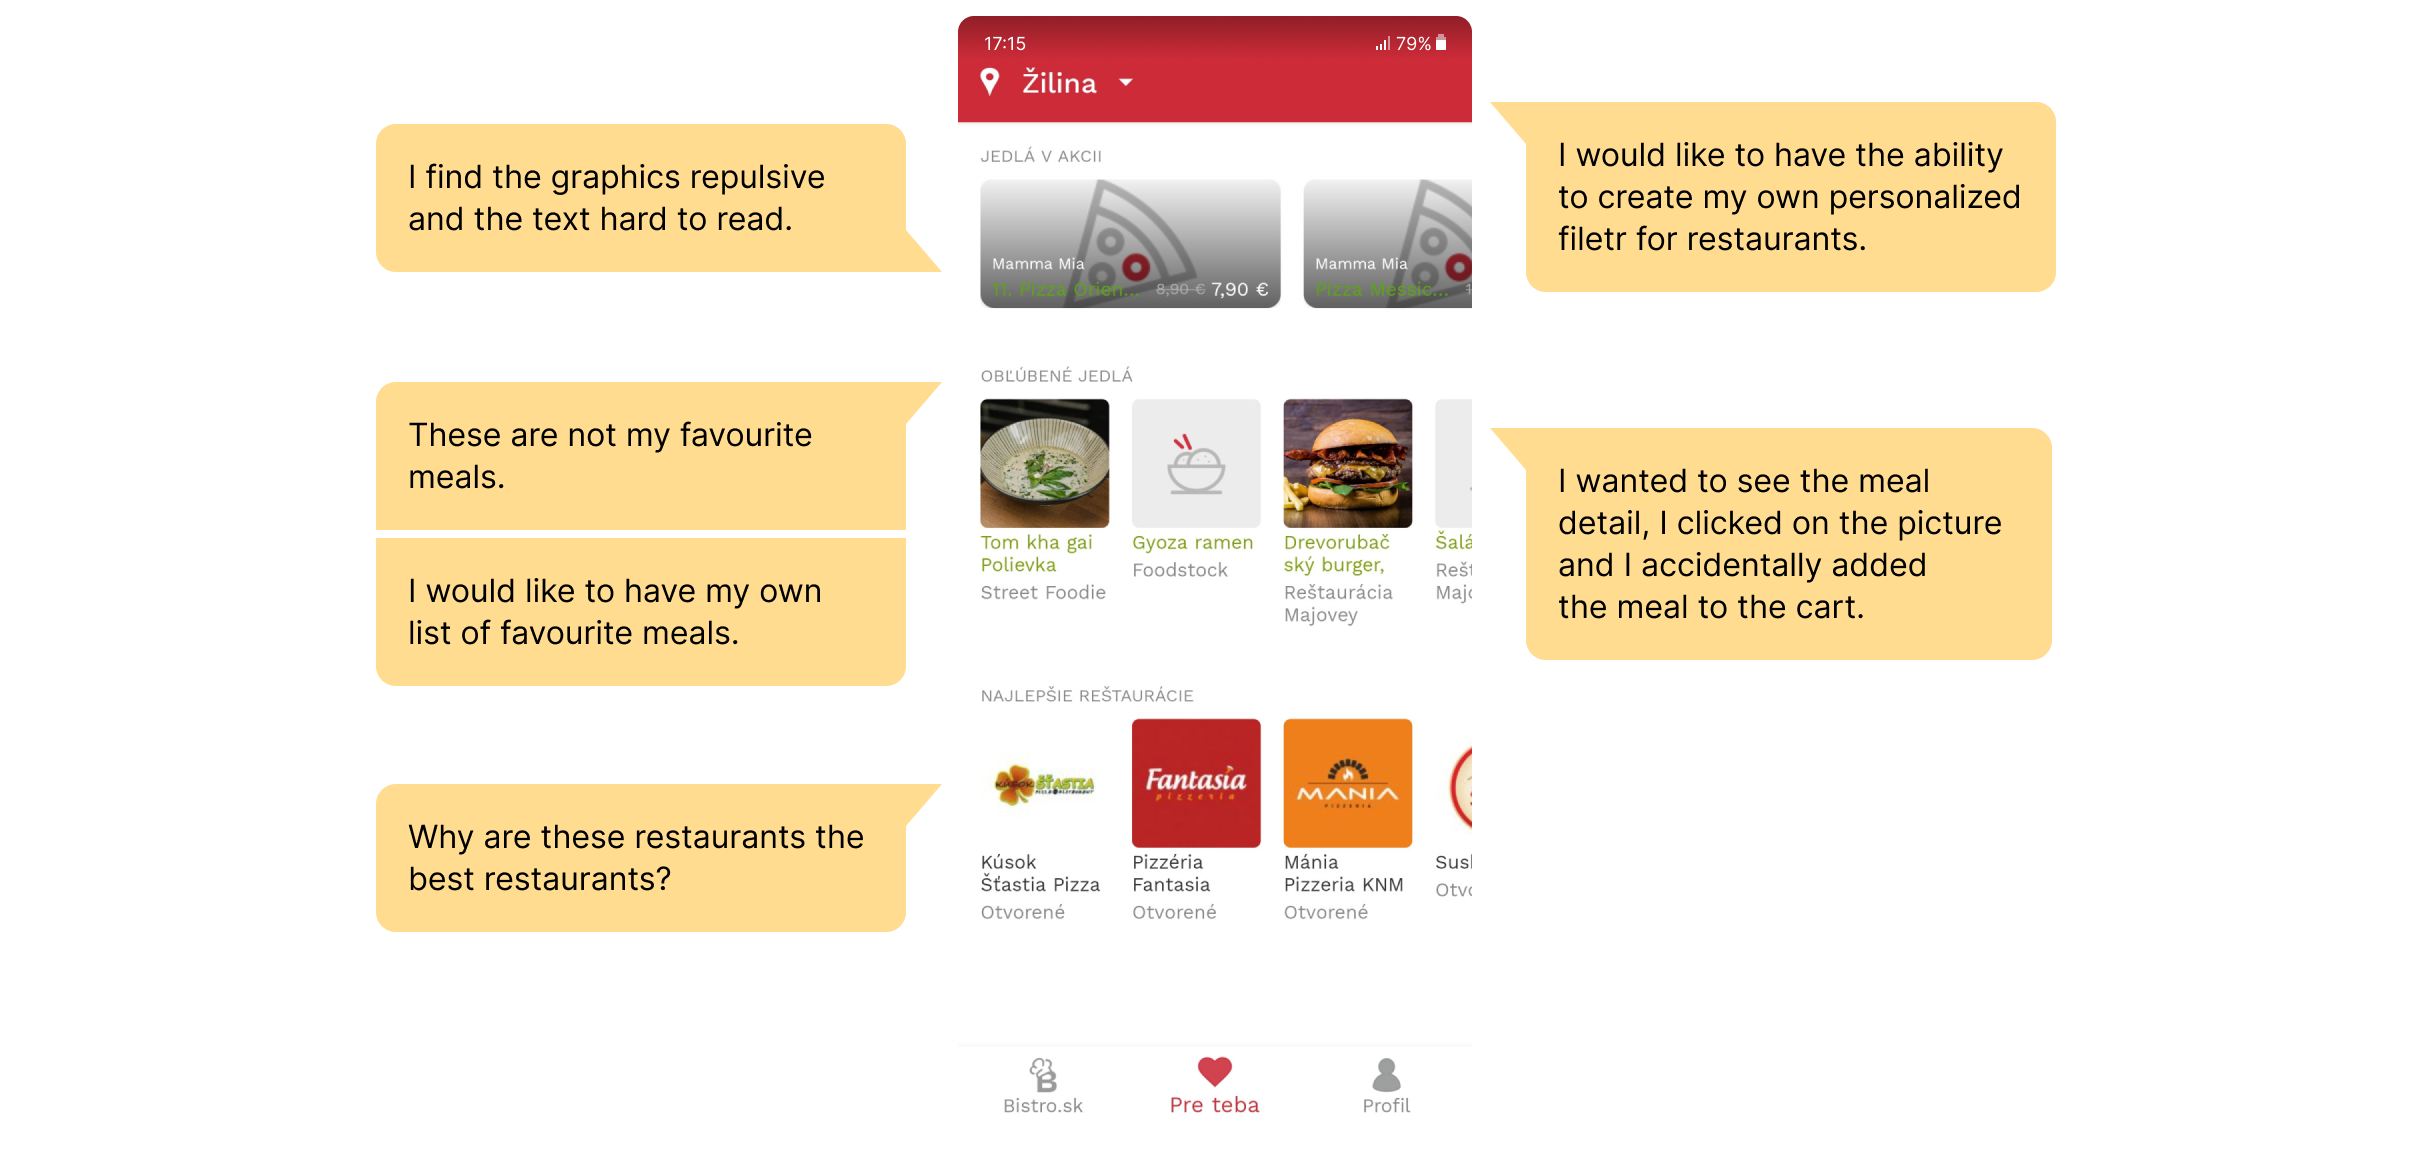
Restaurant users can't find their preferred foods because they can't filter them. Users do not choose from the menu because it is very long. They do not choose from the menu because they are demotivated by low-quality food images and difficult texts to read. Users can't find attractive promotions and discounts because they are hidden in the information.
CONCLUSION

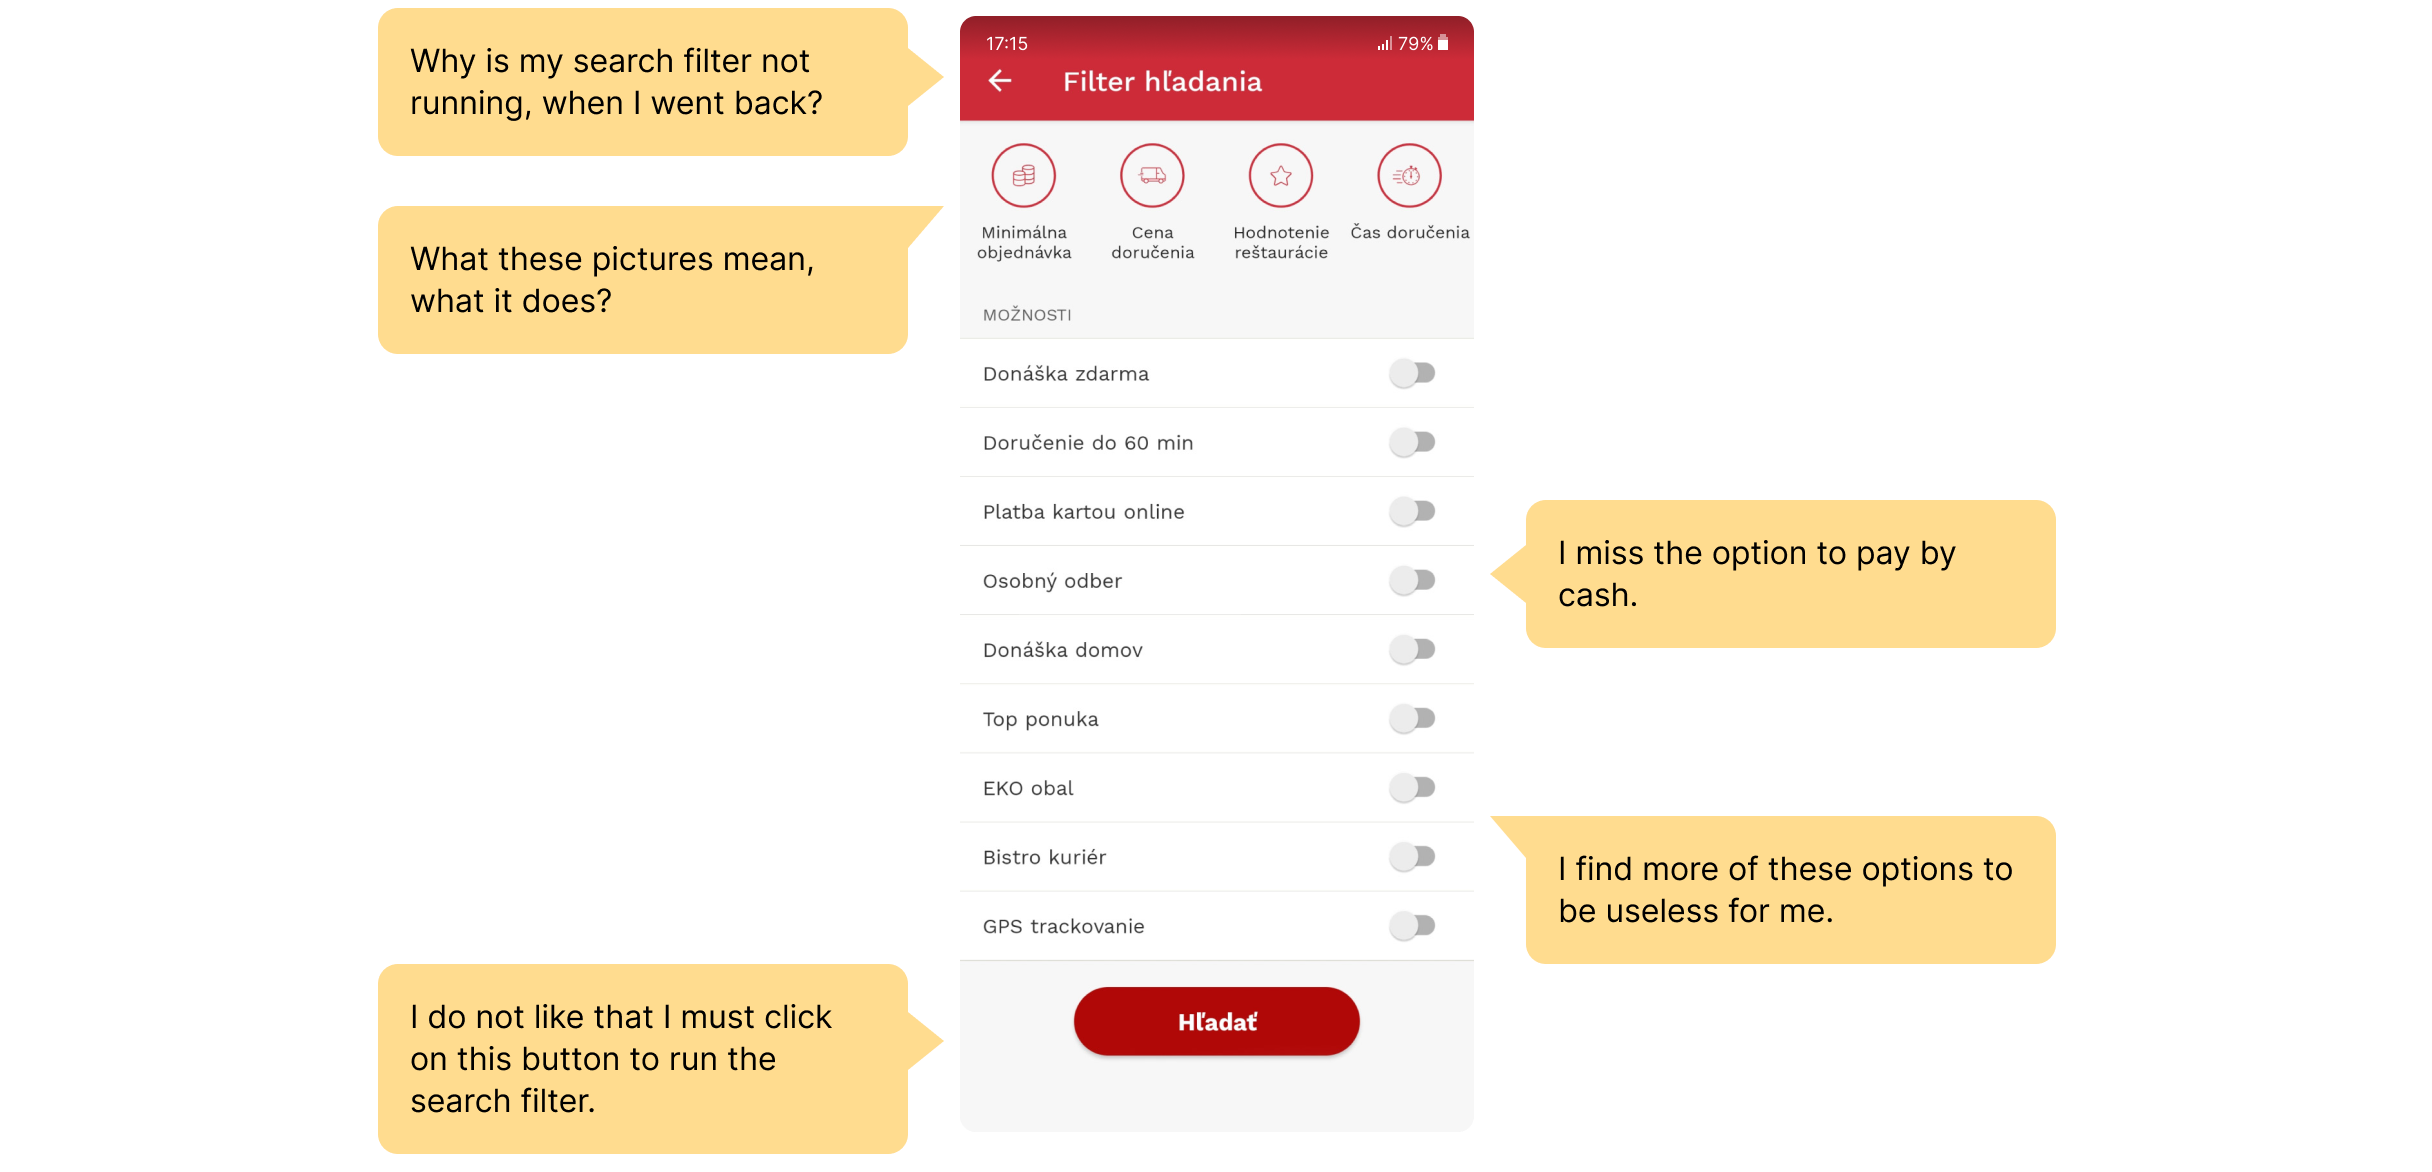
Restaurant filter
There are filters in the application that serve to simplify food selection. We analyzed keyword search, category filter, and search filter. Of all the sessions, only 11% opened the search filter, 18% keyword search, and 30% used the category filter. 70% of users close the search filter without running the filter. 42% of users successfully run the filter. In the search filter, the option to switch to free delivery and delivery within 60 minutes (11%) is the most used (27%), other switching and sorting options are used very little (6%). According to the data from the questionnaire, more than 40% of users choose food by price, review or delivery time. Despite the interest in restaurant and food filtering, the search filter is rarely visited and most functions are not used.

HYPOTHESIS
This rare usage of the filter is due to the fact that users do not know the filter and do not need the filter functions. The reason for the high number of filter closures without triggering the filter is that after setting the filter, users click the back button instead of the search button. The sorting feature is little used because users just overlook it.
CONCLUSION

"For you" section
"For you" section represents lists of users' favorite meals, the best restaurants and discount offers. Only 4% of all users open this section and less than 1% of users click on the meals from the lists. According to the survey, more than 70% choose restaurants and meals according to their liking, 18% choose new meals, 18% are interested in special offers and 25% do not know about special offers. Despite the users' interest in favorite meals, restaurants and special offers, "For you" section is rarely visited and they are used minimally for links to individual lists.

HYPOTHESIS
"For you" section has very little traffic because users don't know it. There is a low click-through ratio on the lists of meals because the lists of favorite meals and restaurants are not personalized, the list of the best restaurants does not have any detailed information and users do not look for discount offers here.
CONCLUSION


Cart with additional sales
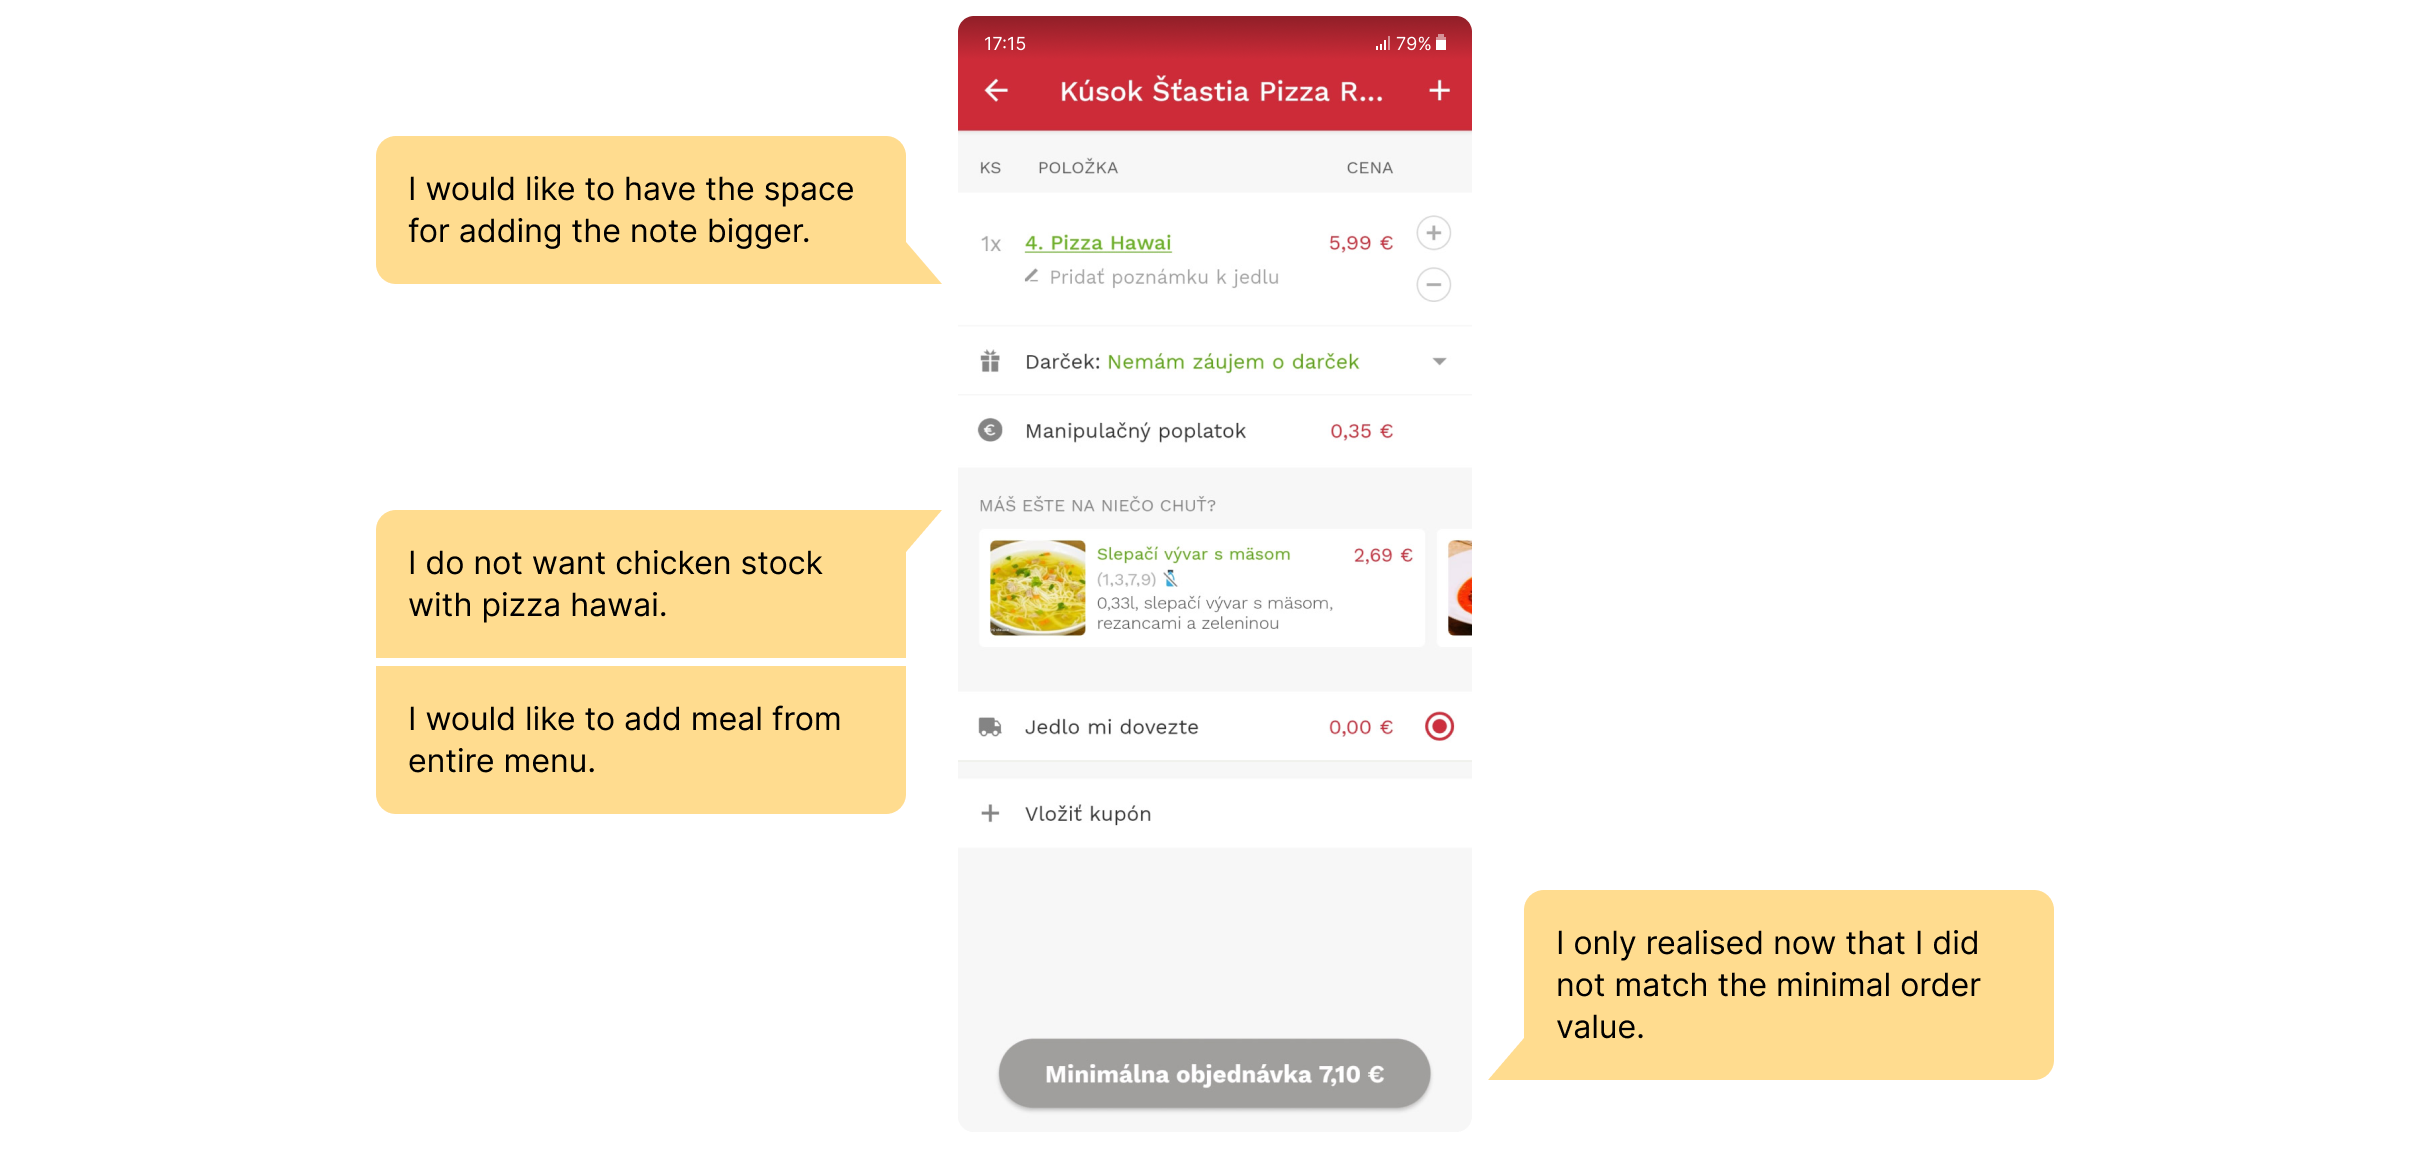
The food ordering process ends in a cart, where users have the last chance to add or remove food from the order. Only 1.5% of users with an open cart will open the offer, which is used for additional sales. The problem is a very low number of displays.
HYPOTHESIS
The menu has a low number of openings, because the link to the menu for additional orders is hidden only at the end of the horizontal list of presented meals. The presented meals of additional sales do not visually motivate to view the entire menu.
CONCLUSION

05Benefit
UX research makes decisions based on facts, saves costs and determines the strategic direction
Relevant information is the basis of the product strategy. The quality of these basics determines the success or failure of a product on the market. User experience research provides valuable information about users, detects problems, and identifies opportunities for product improvement. The acquired information is based on decisions with facts, it helps to take the right steps and minimizes the costs caused by wrong steps.
We presented the research results to the client with in the following points:
- Needs, experiences and preferences of product users.
- Application usage report.
- Usage of the most important sections and functions.
- Summary of the user research problems.
- Recommendations for improving the user experience.
In conclusion, it is important to say that the user experience is constantly evolving and the process of improving will never end. We acquired information from UX research at the beginning of 2021. For the right product direction, it is necessary to continue the research to find out what change has occurred over time and what change has been made by the implemented proposals resulting from the recommendations. At the same time, it is necessary to monitor what change the new FoodPanda player has brought to the dynamic market, the unstable pandemic situation or new Bistro.sk brand look. The repeated research will enable to map the user experience over time and help make product strategy decisions.
We cooperate with GoodRequest for some years and I have to say that the cooperation goes beyond expectations. Guys have a profesional approach and take initiative in proposing innovations that helps us to advance in our business. They operate with motto: nothing is impossible.
Ready to start a project?
Let's build together.
Schedule a call or send an email.
Contact usNot sure where to start? Download our product brief template.